Synchronised Browser Debugging
How to synchronise browser debugging
By Anton Ball

Adam Argyle has a great series on YouTube called GUI Challenges about creating different UI components, breaking down the process, and challenging others to get involved. It’s worth a watch for any Frontend UI developers.
Something that stood out to me in the videos was Adam’s setup for browser testing. What he showcases in the affectionately titled Debugging Corner chapter is something I wanted too.
The video gave a few ideas of how it’s setup:
- Android Emulator,
- iOS Simulator,
- Regularly installed browsers, and the magic part
- Browsersync keeping it all in sync
I wasn’t able to find a write up or video on Adam’s setup, so here’s how I, ahem, emulated the Debugging Corner.
Browsers
The browser install was already handled. Safari is pre-installed on my machine and Firefox and Chrome were installed through Homebrew. But you can also head to the browser websites to install them yourself.
The Android Emulator, that took a little effort, so here’s how to get that up and running.
Android Emulator
We are going to need Android’s command line tools to set up and run the Android Emulator and its requirements. There’s packages available on the Android Studio site but it can also be handled with Brew.
brew install --cask android-commandlinetoolsDuring the installation you may see this note about requiring Java. Make sure you have it available in some form to run the command line tools. I ended up using the recommended install command.
android-commandlinetools requires Java. You can install the latest version with:
brew install --cask temurin
Another output will be this message, which is important for later as we need to know where our Android SDK and tools are located
Default Android SDK root is /usr/local/share/android-commandlinetools
With the command line tools installed we can now set up the various SDKs, platform tools and system images, run:
sdkmanager "platforms;android-33" "platform-tools" "system-images;android-33;google_apis_playstore;x86_64"I went with the most recent version of Android but this might be different when you are following these instructions. use the list command with sdk manager to see what’s available:
sdkmanager --listThis is handy in that it will also show you what’s already installed and let you manage updates. Check the official documentation for more details .
Next we need an Android Virtual Device, or AVD for short. This is what the emulator command will use to emulate the Android device. Think of it like the phone.
avdmanager create avd --name android-33-pixel --device pixel_5 --package "system-images;android-33;google_apis_playstore;x86_64"There’s two required pieces of information. First, the name, which we will use to tell the emulator which device to emulate. The other is the package. This is what we installed with sdkmanager and is what describes the Android operating system.
I have also added a device profile, with pixel 5, but this part isn’t required. I just like to set it to a known device.
We are now ready to boot our Android device, remember that path from earlier? This is where we need that.
We can list the available AVDs the emulator can run with:
/usr/local/share/android-commandlinetools/emulator/emulator -list-avdsThen we can run the emulator by providing it the name of the AVD we want to use
/usr/local/share/android-commandlinetools/emulator/emulator -avd android-33-pixelIf you’re going to be running the emulator frequently it could pay to add it to your path or symlink it to your bin directory so you can run emulator instead of the full path every time.
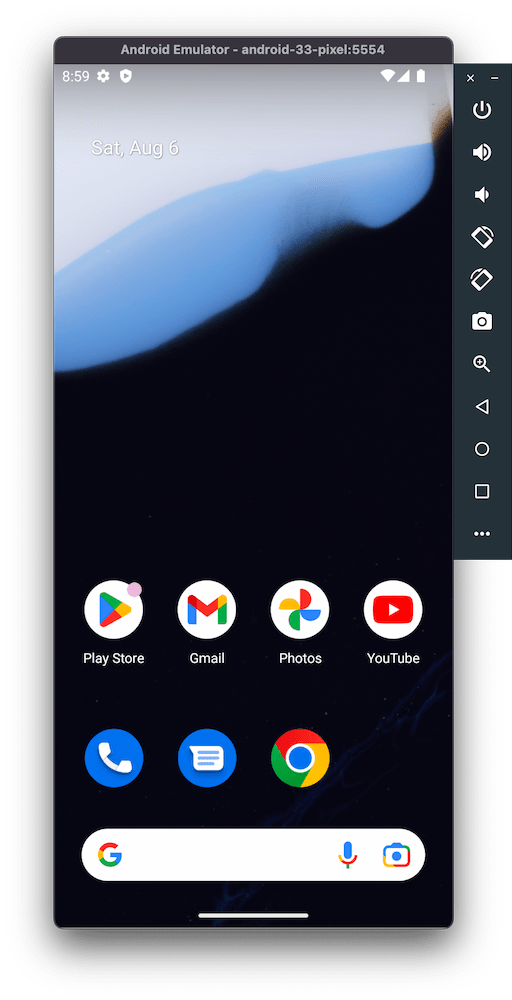
There we go, we have a running Android device with Chrome ready for testing

iPhone emulator
It’s a little easier to install the iOS Simulator.
Download Xcode from the App Store. When I did this it was 12gb! It’s a whopper of a program but with that comes an easier experience.
With Xcode installed, open the app and accept the terms and conditions. The simulators are now available.
I launched the Simulator app with Alfred but you can also find them in the Xcode app contents:
Applications/Xcode.app/Contents/Developer/Applications/Simulator.appSync the browsers
The magic part of Adam’s setup is syncing the browsers across all devices, which is handled by Browsersync . It can be installed globally via NPM which is what I opted to do:
npm install -g browser-syncWe use Next.js for most of our projects, which has its own server, so we can use Browsersync’s proxy mode. If you have a different setup you might be able to integrate it differently, but this is fine for our needs.
In Terminal, change the current working directory to your Next project and kick off the server.
With another terminal tab in the same directory, run:
browser-sync start --proxy "http://localhost:3000/" --files "./"Browsersync is now proxying to the NextJS server and watching for changes.
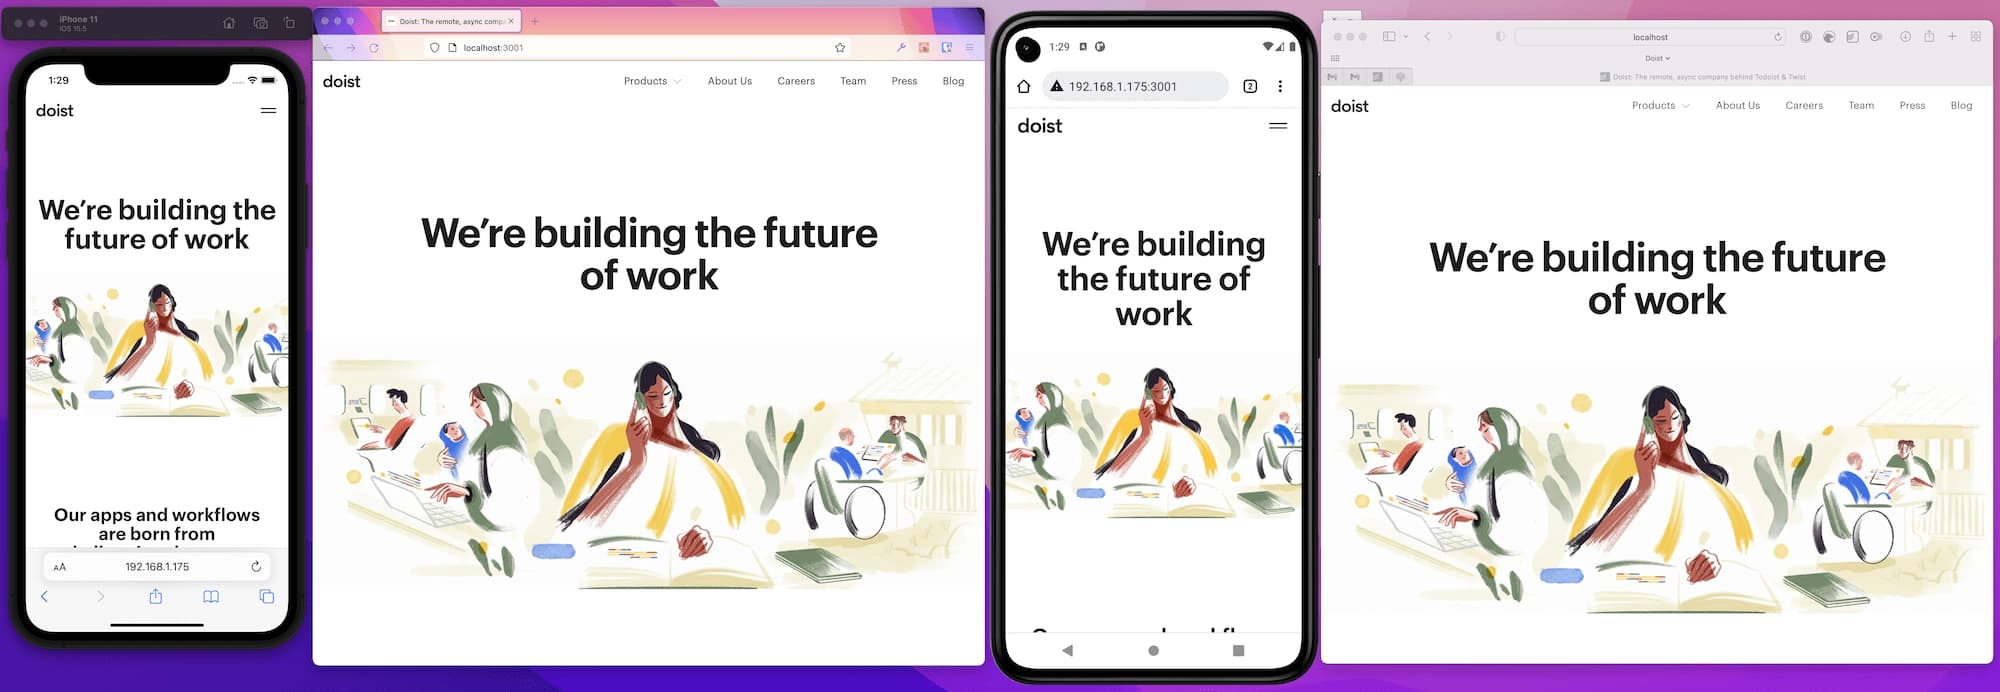
Open each browser and emulator you’d like in your Debugging Corner and navigate to the url that was output from running browsersync’s start command.
Now scroll. Magic! All the windows are in sync and showing across all the emulators and windows.
Next steps
I’m liking this setup both for testing and reviewing as I can test with greater coverage across browsers without repeating the same actions.
It would be great to automate more of the start. Currently I need to kick off each emulator and browser along with Browsersync and navigate to the required URL. Making that a single command would be nice, but I’m still seeing how this fits into my workflow.
Hopefully, you find this setup useful. Shoutout again to Adam Argyle for the idea and motivation.