Optimizing GRDB in Todoist for iOS
The hidden cost of LEFT JOINs in GRDB
In the summer of 2025, we completed our reimplementation of the local storage layer for Todoist’s iOS app, switching from Realm to GRDB . As we began gradually releasing it to our users, the complaints of the app becoming sluggish started to come in.
This article goes into detail on how we debugged and fixed the issues, the approaches we took, and practical tips you can use to debug and improve performance in your iOS app. The most important discovery was replacing how we did associated queries in our GRDB code, but it wasn’t the only one.
Initial findings and fixes
The problem seemed to be mostly around task actions, such as creating a task or completing a task. We rather quickly noticed a few things:
-
The more active observations we had for our GRDB records, the slower the actions were that triggered changes for those observations.
-
There were a couple of places where we hadn’t moved our write operations to a background thread, so those were obvious fixes.
-
We had some complex data structures that had relationships with other tables and were expensive to compute fully. One such object was
Project, for which we needed to compute whether it had child projects or not, number of comments it had, number of completed tasks it had, number of archived sections it had, etc. This was expensive to compute, and most importantly, we didn’t always need all of this information when we were showing information about a project in our UI.
So we shipped our initial fixes:
-
Closing observations for screens that were no longer visible when the user switched from one tab to another.
-
Diligently moving all storage write operations to a background queue.
-
Introducing
ProjectSummarythat had only top-level properties which did not require going to related records to fetch them. We introduced the use of it in some of the most obvious places.
It’s better but not good enough
For some users the situation still did not improve. I was tasked with solving this issue and I was quite happy about it. I love performance tuning tasks. 🤓
How to reproduce it?
The first task in fixing any software issue is finding a way to reproduce it. My usual choice for this is using the slowest device in my collection that can run the minimum iOS deployment version of the app. But actually it’s not enough, you should also enable Low Power Mode for it. Did you know that iPhone 15 Pro in low power mode is slower than iPhone 12 in normal mode? Well, at least in our case, it was.
So roughly my plan was:
- Create a sample account with lots of data
- Run device in low power mode
- Perform task action in Instruments (System Trace)
- Look for code where CPU time is mostly spent and see if it can be optimized
Pretty quickly I realized that it would be easier if I marked task completion with OSSignposter . The idea is that then in Instruments I could click on the interval I’m interested in to select it, then click on the thread that performs the most activity in that interval (determine it visually by looking at CPU use between threads) and then inspect the stack of function calls to see where the time is spent.
How to confirm your suspicion?
If I suspect some part of the code to be slow, my favorite way of confirming it is just commenting out that part of the code and seeing how performant the app is after that.
I had a few suspects:
-
Were there thread priority inversion issues with sync tasks that we perform in the background?
-
Was Spotlight indexing generating
AppEntitiesof our domain objects while on a background queue too intensive? -
Was the recursive count of tasks in a project and its subprojects the main culprit that was slowing down
Projectfetching?
I checked those and a few other things during my hunt for optimization opportunities.
Low-hanging fruit
It wasn’t quick, in total I went through over 40 sessions of System Trace. Most of my optimizations were avoiding fetching Project where possible (expensive, as explained above), and some were optimizations that were not related to the storage layer at all, such as fixing a few memory leaks and caching results of Date operations.
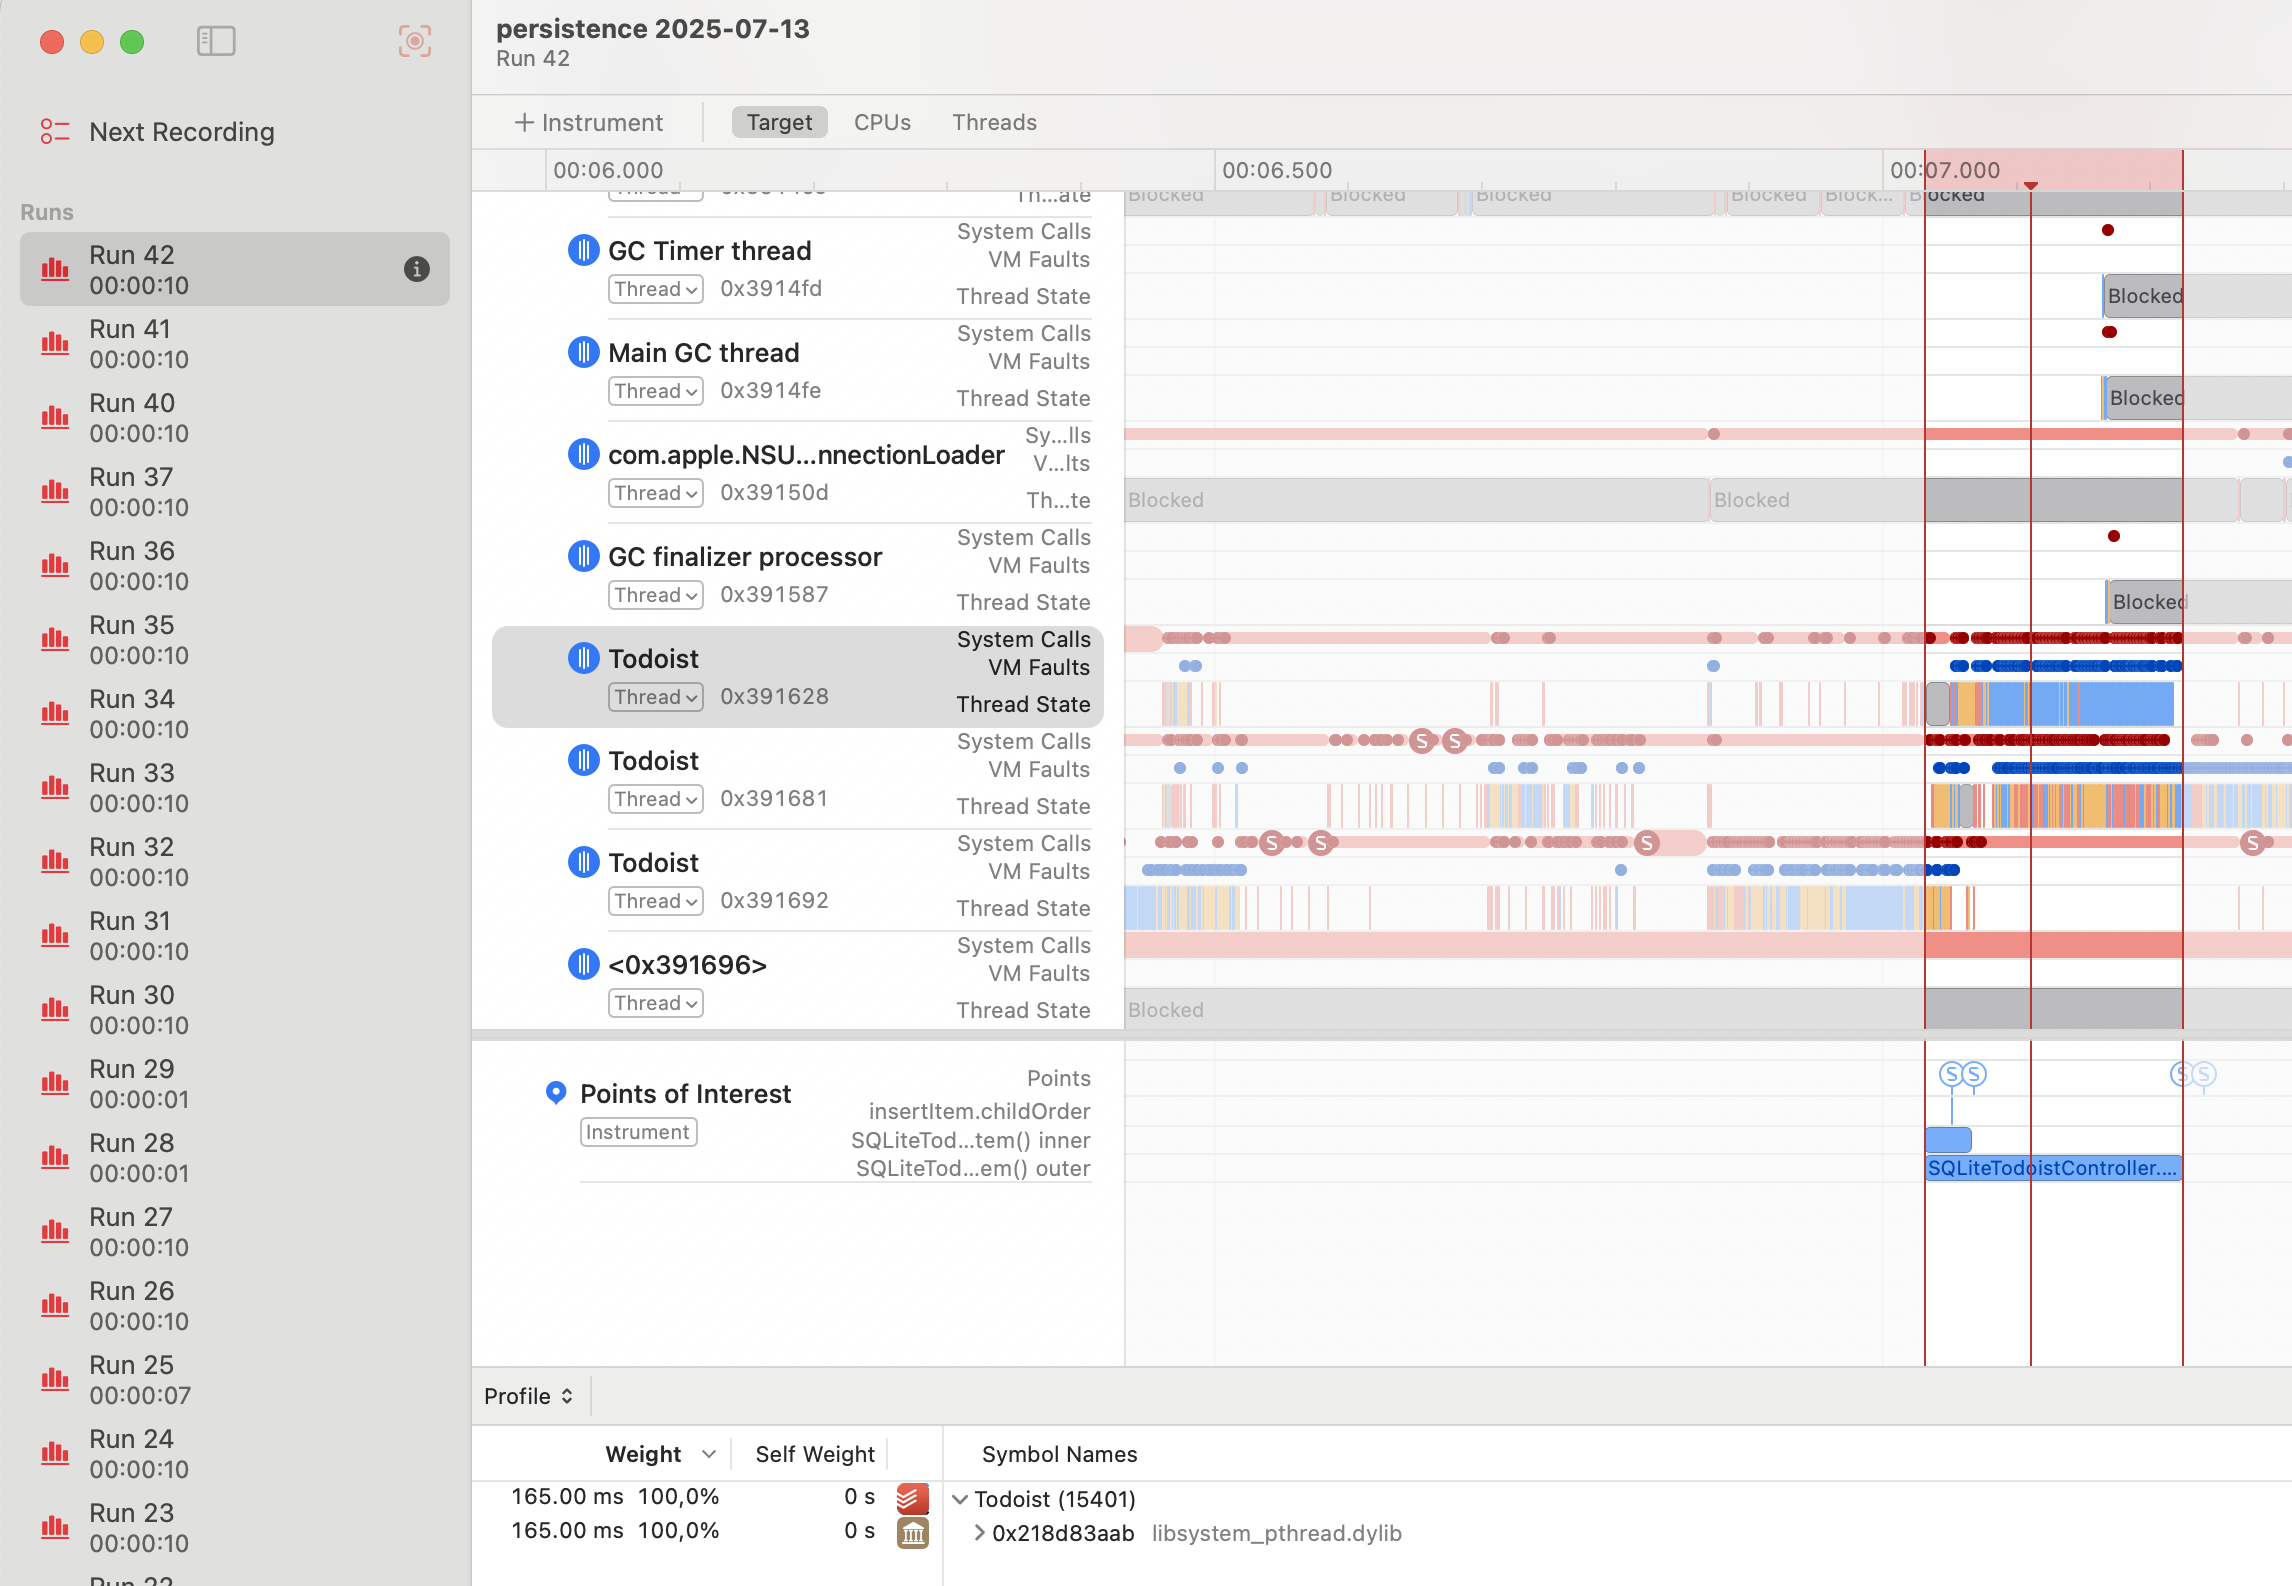
System Trace showing CPU activity during task creation
Doubts creep in…
After I had picked the low-hanging fruit, the gains in my sample account were about 40% speed improvement per task action but that didn’t give me the confidence that this would fix it for those users who complained about our app becoming almost unusable.
Some difficult questions came to mind:
-
We had migrated our app from a storage layer with optimized in-memory object graph (Realm) to a solution which, even though it was simpler to understand and operate (GRDB), didn’t have this in-memory optimization. Wasn’t the whole point of Realm or Core Data to optimize objects kept in memory so that you’d avoid extra disk I/O operations? Were we using the wrong tool for the job? 🤔
-
We knew fetching projects with all their relationships from other tables was slow, but what could we do about it in places where we did need that data? Was it possible to optimize those fetches given that we were using the GRDB API correctly (or so it seemed)?
Was it possible to speed up project fetching? There’s only one way to find out, so I set out to try to optimize full Project fetching. 🛠️
Optimizing fetching associated values
Performance tests
As I started my attempt, I decided that to make my improvements (if I found them) easy to prove, I would create a performance test where I perform the slow operation many times. I’d add the test first and then the reviewer of my PR would be able to compare before/after results of my changes without the hassle of running the app in Instruments. Another benefit of this approach were faster iterations — I no longer needed to re-run the app in Instruments, create tasks in it, and then look for time spent in my Points of Interest (as marked by OSSignposter) intervals.
The plan for the test itself was simple:
- Create a project with lots of tasks in it (similar to what I used in my manual actions in Instruments)
- Measure time spent in creating a task
- Try different kinds of optimizations and re-run the test to confirm whether they are moving the needle
Unexpected discovery
As I followed the plan, I pretty quickly hit the wall. The performance of task creation in my test was way faster than when I did it manually in the app! As I was tinkering with this, I discovered another surprise: manual task creation in a new project which seemed similar to my normal test project also was way faster than expected. So what was so special about this slow project? Let’s find out, I thought, as I duplicated the project and tried to create a task in the duplicate, but… it was still fast 😳 So how was that possible? What would make creating a task in one particular project significantly slower than in its duplicate?
After some head scratching and LLDB sessions I finally got it. What made projects slow in our case was not only having lots of uncompleted tasks but also having lots of completed tasks and lots of comments. When duplicating a project, completed tasks and comments are not duplicated (that’s by design).
So the conclusion was clear. Task actions were not slow in just any kind of projects, but those that corresponded to a certain data profile. I.e., with a significant amount of tasks, completed tasks and comments. It made sense - after all, those were the related tables that we were getting records from for Project relationships. The question became, what could I do about it?
Associated values in GRDB
Let’s back up a little with a small recap on how associated values and relationships between records work in GRDB. Here is much more thorough documentation.
- You would typically define a type conforming to
TableRecordthat matches records stored in a given table.
struct Project: TableRecord {
    ...
}

struct Task: TableRecord {
    ...
}- You would also define static properties as associations for relationships to other records.
extension Project {
    static let tasks = hasMany(Task.self)
}

extension Task {
    static let project = belongsTo(Project.self)
}- If you wanted to fetch a project and the number of tasks that it has you would use
Project.annotated(with: Project.tasks.count)when forming the request.
When you’d use .annotated() with associations, GRDB would generate SQL queries like this:
SELECT project.*, COUNT(DISTINCT task.id)
FROM project
LEFT JOIN task ON task.projectId = project.id
GROUP BY project.id
GRDB infers table names from type names and foreign keys from association names 👆
Finding the culprit
After I had discovered what made fetching projects slow (a combination of many tasks, many completed tasks and many project comments in the same project) I decided to investigate if our SQL setup was optimal. Maybe we were missing an index?
I had to get my hands on some raw SQL.
Logging of SQL statements
My first approach was to add a configuration for GRDB DatabasePool that would log all executed SQL queries to the console. Something like this:
// Configure GRDB to log all SQL statements
var config = Configuration()
config.trace = { sql in
    print("SQL: \(sql)")
}

// Use the configuration when creating your database connection
let dbPool = try DatabasePool(path: "/path/to/database.sqlite", configuration: config)
The problem with this approach was that it was causing the console to be extremely noisy. It wasn’t easy to tell which query was coming from actual task creation and which was coming from perhaps some other background process. I needed a more targeted approach.
Logging an SQL query of a specific GRDB PreparedRequest
In order to get only the query that I actually need, I adjusted the code slightly (or perhaps used a breakpoint and LLDB print commands). Here is our example from above to illustrate it:
let request = Project.annotated(with: Project.tasks.count)
let preparedRequest = try request.makePreparedRequest(db)
let sql = preparedRequest.statement
print("SQL for fetching projects: \(sql)")
Alright, so I had this big SQL statement (in reality we had way more associated values than just task count). Now, how would I be able to tell whether it makes sense or has opportunities for improvement? Easy! Pass it to an LLM of course! 😁
Claude comes to help
As I’m now reviewing a couple of conversations with Claude that I had at the time it’s clear that the path to the final breakthrough wasn’t straightforward. Many ideas, countless contradictions, a lot of confusion, back and forth and some cursing from my side. 😅 But here follows the main thing that helped me to move forward:
Printing total number of intermediate rows of the query.
At some point Claude suggested that I temporarily update the query to print out total rows that it generates. You can do this the following way:
- Remove
GROUP BYfrom your query - Replace your
SELECTstatement withSELECT COUNT(*) as total_intermediate_rows - Print the value that you get for
total_intermediate_rows. - Using code with our above example that would be:
let sql = """
    SELECT COUNT(*)
    FROM project
    LEFT JOIN task ON task.projectId = project.id
    WHERE project.id = ?
    """

let count = try Int.fetchOne(db, sql: sql, arguments: [projectLocalID])
print("Intermediate rows being processed: \(count)")
For the project in which task creation was slow, the total number of intermediate rows was 128,136 which seemed like too many rows… 🤨 Then we continued printing the row counts for each of the LEFT JOINs. And the math was conclusive:
- 114 completed tasks
- 281 uncompleted tasks
- 4 comments
114 x 281 x 4 = 128,136 🎯 😮
JOINs can be dangerous
So a rather small amount of data caused so many intermediate rows, why?
When you use .annotated(with:), GRDB uses LEFT JOINs under the hood. This is useful when you need actual records from child tables, but for aggregates like counts, it’s inefficient—especially with to-many associations. SQLite computes a temporary table containing all child records for each parent, then groups by parent key and replaces all those rows with a single Int, discarding all the work that went into creating the temporary table.
The problem becomes real when you annotate your request with data from multiple child relationships.
For example, if you have a project with 200 uncompleted tasks, 100 completed tasks and 30 comments, then three LEFT JOINS will result in a Cartesian product of a single project record and then all the matching records from these JOINs, so in this case:
1 * 200 * 100 * 30 = 600,000 i.e. it would create a temporary table with 600,000 records while in fact in order to complete the work, all it needed to do was:
- fetch count of 200 uncompleted tasks
- fetch count of 100 completed tasks
- fetch count of 30 comments
i.e. 1 + 200 + 100 + 30 = 331 rows.
So what is the better approach to get those aggregate results?
Subqueries!
In SQL terms instead of doing this:
SELECT project.*,
    COUNT(DISTINCT task1.id) AS uncompletedTasksCount,
    COUNT(DISTINCT task2.id) AS completedTasksCount,
    COUNT(DISTINCT comment.id) AS commentsCount
FROM project
LEFT JOIN task task1 ON task1.projectId = project.id AND NOT task1.isCompleted
LEFT JOIN task task2 ON task2.projectId = project.id AND task2.isCompleted
LEFT JOIN comment ON comment.projectId = project.id
GROUP BY project.id
we could be doing this:
SELECT project.*,
    (SELECT COUNT(*) FROM task WHERE task.projectId = project.id AND NOT task.isCompleted) AS uncompletedTasksCount,
    (SELECT COUNT(*) FROM task WHERE task.projectId = project.id AND task.isCompleted) AS completedTasksCount,
    (SELECT COUNT(*) FROM comment WHERE comment.projectId = project.id) AS commentsCount
FROM project
For GRDB we can rewrite this nice-looking but non-performant code:
let uncompletedTasksCount = Project.uncompletedTasks.count
let completedTasksCount = Project.completedTasks.count
let commentsCount = Project.comments.count

Project
    .annotated(with: uncompletedTasksCount, completedTasksCount, commentsCount)
into:
// Note: We use raw SQL for the filter because we need to reference
// the outer query's table. Using Task.Column.projectId == Project.Column.id
// wouldn't work as GRDB doesn't handle cross-query table references.

let uncompletedTasksCountExpression = Task
    .filter(sql: "projectId = project.id")
    .filter(!Task.Column.isCompleted)
    .select(count(Task.Column.id))

let completedTasksCountExpression = Task
    .filter(sql: "projectId = project.id")
    .filter(Task.Column.isCompleted)
    .select(count(Task.Column.id))

let commentsCountExpression = Comment
    .filter(sql: "projectId = project.id")
    .select(count(Comment.Column.id))

// We must alias the Project table explicitly because our subqueries
// reference "project.id". Without this, if JOINs are added later,
// GRDB might auto-alias the table to "project1", breaking our raw SQL.

Project
    .aliased(TableAlias(name: "project"))
    .annotated(with: uncompletedTasksCountExpression, completedTasksCountExpression, commentsCountExpression)
And it will be way faster for projects which have a significant amount of all three kinds of components.
How much faster?
Well, it depends. The more data you’d have in the related tables, the slower the original query and so the bigger the speed difference with the optimized one. That also explains why for some of our users the app was almost unusable, while we could reproduce only annoying hitches.
In the PR where I shipped this change the performance test showed 99% speed improvement on my machine and 90% on my teammate’s machine (different CPUs).
Conclusion
So with these improvements (and a couple of others done in the same spirit) we fixed the performance issues, and it turned out that GRDB works just fine as a storage layer for our app. We just need to be mindful of when we need full records with associations and how we fetch them.
If you’re facing similar issues, I’ve compiled a list of practical tips below that helped me on this journey 👇
Practical Tips
-
The first thing you need in order to fix performance problems that users are experiencing is being able to reproduce them.
- In this case I stumbled on the same performance issues as our users had, but in a less pronounced way. It was partly by luck and partly by persistence of trying different things.
-
Use Low Power mode to make your device slower.
-
Comment out code you suspect may be the culprit, this way you can narrow down your search for the bottleneck.
- You’ll often need to temporarily adjust the code after commenting out chunks of it so that you can still compile and run it without breaking the app.
-
Use Instruments with System Trace to hunt for optimization opportunities.
- I prefer System Trace to Time Profiler because it has more information such as thread states.
-
Wrap the code you are optimizing with
OSSignpoststo make working in System Trace easier. -
After you have identified bottlenecks in your code and you have some ideas on how to optimize them, you could make it more measurable by creating performance tests that make it easy to isolate and measure your improvements.
- In my case it also highlighted that I actually didn’t understand the cause of the performance problem fully (i.e., specific data structure requirements).
- Performance tests do not necessarily need to be included in CI afterward since the baseline can fluctuate a lot. In my case I used them only as a development tool and PR review helpers.
-
If you determine that your bottleneck is fetching all associated values of a full-blown object and you can’t speed it up, consider whether you always need the full object — it might be possible to use a simpler “summary” object in some cases.
Tips specific to GRDB
-
You can enable logging of all SQL queries by printing SQL in the trace closure of your
Configurationstruct that you pass when creatingDatabasePoolor by creating aPreparedRequestand printing out its statement in the specific place you are interested in. -
After you have your SQLs, pass them to an LLM and ask it to analyze the query for potential performance issues.
-
You can prepend
EXPLAIN QUERY PLANto your SQL statement and you will get more information on how SQLite executes this kind of query. This can help you to highlight issues with missing indexes.- Wasn’t useful in this particular case, but it has been a useful tool for me in the past.