Bitmapist
How we built an open-source analytics tool that saved millions and transformed our decision-making
At Doist, we love making smart bets. Sometimes, the smartest decision isn’t to pick the biggest or shiniest tool out there but to build a small tool that does exactly what’s needed. That’s how Bitmapist came to life—a powerful, open-source cohort analytics library that’s been quietly driving smarter decisions and saving us millions of dollars.
Why We Built Bitmapist
Several years ago, we faced a common startup challenge: we needed robust cohort analytics to gain a deeper understanding of how people use Todoist and Twist . We needed answers to specific, critical questions about user behavior, such as:
- How many users adopted our newest feature this week?
- What percentage of users who were active last month are active today?
- Which features drive long-term user retention?
At our scale, commercial analytics platforms often charge astronomical prices or provide limited flexibility for custom queries. True to our philosophy that tools should adapt to our needs (and budget), we opted to build a tailored solution instead of settling or overspending.
Why Bitmaps?
The secret behind Bitmapist’s performance lies in its name—bitmaps. Using Redis bitmaps , Bitmapist stores massive amounts of event data with minimal memory usage, allowing us to track millions of user interactions and billions of events efficiently. This approach enables real-time analytics queries, returning cohort data in milliseconds.
Here are a few powerful questions this approach effortlessly answers for us:
- Is user X active today, this week, or this month?
- How many users performed action Y over a certain period?
- How many users who performed action A also performed action B?
How Bitmapist Improved Our Decision-Making
Bitmapist hasn’t just simplified analytics; it’s transformed how we make decisions at Doist. Here’s how:
🚀 Smarter Feature Launches
When we release a new feature, Bitmapist helps us track user adoption and retention seamlessly. For instance, after launching Todoist’s board view, we could immediately see how many users tried it, how many kept using it, and how it impacted long-term engagement. These insights enabled us to rapidly iterate on and improve the feature, significantly enhancing user satisfaction.
🎯 More Effective A/B Testing
Bitmapist empowers us to run A/B tests and monitor their long-term impacts effortlessly. By analyzing how different user cohorts behave over time, we’ve fine-tuned our onboarding process, directly resulting in increased user retention.
⚡ Rapid Decision-Making
Because Bitmapist operates in real-time, we can quickly make informed decisions without waiting days for batch analytics. Our product, design, engineering, CX, and marketing teams regularly run cohort queries, empowering them with immediate insights without bottlenecks or dependencies on specialized data teams.
💰 Huge Cost Savings
By building Bitmapist internally, we’ve saved millions of dollars in analytics fees over the years. We’ve also built a hyper-optimized bitmapist-server that does not use Redis.
Before migrating to bitmapist-server, our Redis setup consumed nearly 130GB of memory. With our improved standalone Bitmapist server, the same dataset now consumes 300MB of memory—a 443x reduction in memory usage! This optimization alone translates to massive infrastructure cost savings.
Lightning-Fast Cohort Visualization
One of Bitmapist’s most valuable features is its built-in cohort visualization, which teams across Doist use daily. Whether marketing is measuring the impact of a new campaign, or product is tracking retention patterns after a feature launch, everyone can quickly generate clear, real-time charts that answer pressing questions in seconds.
Here’s an example of our cohort view in action:
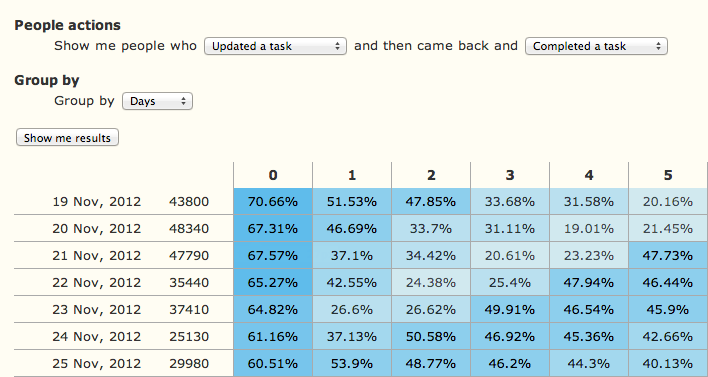
From a simple dashboard, we can see how many new users signed up in a given period, how many returned in the following weeks or months, and how retention evolves. This runs on the same efficient bitmap infrastructure, so we get immediate results without massive data pipelines or slow batch jobs.
This real-time visibility into user behavior ensures our teams can identify trends early, quickly spot drop-offs, and focus on creating simple yet powerful tools that truly empower people.
Getting Started with Bitmapist
At Doist, we deeply value open source software and we’ve benefited immensely from it over the years. Open-sourcing Bitmapist was a no brainer.
We’ve made it incredibly simple for you to integrate it into your applications:
-
Install via pip:
pip install bitmapist -
Set up Redis or our memory-efficient bitmapist-server .
-
Mark events easily:
from bitmapist import mark_event # Marking an event for user 123 mark_event('active', 123) -
Query your data effortlessly:
from bitmapist import MonthEvents

# Check if user 123 was active this month
assert 123 in MonthEvents('active')
Full documentation, examples, and setup instructions are available on our GitHub page .
Bitmapist started as a simple internal project but quickly became a cornerstone of our analytics strategy at Doist. It’s allowed us to make better, data-driven decisions, innovate faster, and substantially reduce costs. Open-sourcing Bitmapist invites you to join us in building better analytics tools that benefit everyone.
Give Bitmapist a spin, check out the GitHub repository , and let us know your thoughts. We’re excited to see how it helps your team! 🚀